Stochastic
Source
https://github.com/quadcode-tech/quadcodescript-library/blob/master/momentum/stochastic.lua
Syntax Format
stochastic(series, period)
Overview
The Stochastic Oscillator is an indicator in the Momentum group, which can help you get information on potential trend reversal as well as show the overbought and oversold states of an asset. Even though this indicator was created back in the 1950s, it is still considered one of the most popular oscillators because of its simplicity and efficiency.
Parameters
| Parameter | Type | Purpose |
|---|---|---|
| series | series | Input series, taken into calculation |
| period | integer | Period, taken into calculation |
Returns: series.
Example
instrument { name = "Stochastic" }

input_group {
    "%K Line",
    k_period = input (14, "period", input.integer, 1),
    smooth = input (3, "smoothing", input.integer, 1),

    source = input (1, "source", input.string_selection, inputs.titles),

    k_color  = input { default = "#56CEFF", type = input.color },
    k_width  = input { default = 1, type = input.line_width}
}

input_group {
    "%D Line",
    d_period = input (3, "period", input.integer, 1),

    d_color  = input { default = "#FF7700", type = input.color },
    d_width  = input { default = 1, type = input.line_width}
}

input_group {
    "Support Lines",
    overbought = input (80, "overbought", input.double, 1, 100, 1, false),
    oversold = input (20, "oversold", input.double, 1, 100, 1, false),

    overbought_color  = input { default = rgba(37,225,84,0.50), type = input.color },
    oversold_color  = input { default = rgba(255,108,88,0.50), type = input.color },
    bg_color  = input { default = rgba(255,255,255,0.05), type = input.color },

    support_width  = input { default = 1, type = input.line_width}
}

local sourceSeries = inputs [source]

k = sma (stochastic (sourceSeries, k_period), smooth) * 100
d = sma (k, d_period)

fill_area (overbought, oversold, "", bg_color)

hline { value = overbought, color = overbought_color, width = support_width, style = style.dash_line }
hline { value = oversold, color = oversold_color, width = support_width, style = style.dash_line }

plot (k, "%K Line", k_color, k_width)
plot (d, "%D Line", d_color, d_width)

hline { value = 90, color = rgba(255,255,255,0), show_label = false }
hline { value = 10, color = rgba(255,255,255,0), show_label = false }
Formula
The formula for calculating Stochastic is:
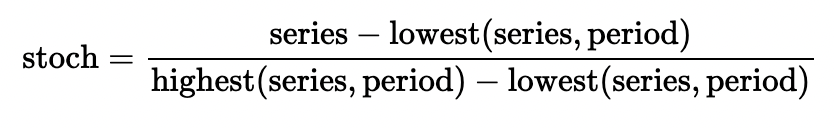
The formula represents the calculation of the indicator's %K line, which considers the closing price value to the previous highest and lowest values over the chosen period. Another element of the indicator, which is the %D line, operates as an MA to the %K line.