CCI
Source
Syntax Format
cci(series, period)
Overview
CCI (Commodity Channel Index) is an oscillator, which uses the corridor of set frames, within which an average price function moves. The breaking points of the moving average over the set levels can identify potential trend reversals, as well as overbought and oversold states of an asset.
Parameters
| Parameter | Type | Purpose |
|---|---|---|
| series | series | Input data, taken into calculation |
| period | integer | Input period, taken into calculation |
Returns: series.
Example
instrument { name = "Commodity Channel Index", icon = "indicators:CCI" }

input_group {
    "Commodity Channel Index",
    period = input (20, "period", input.double, 1),

    color  = input { default = "#FBE90C", type = input.color },
    width  = input { default = 1, type = input.line_width}
}

input_group {
    "Support Lines",
    overbought = input (100, "overbought", input.double, -200, 200, 1, false),
    oversold = input (-100, "oversold", input.double, -200, 200, 1, false),

    overbought_color  = input { default = rgba(37,225,84,0.50), type = input.color },
    oversold_color  = input { default = rgba(255,108,88,0.50), type = input.color },
    bg_color  = input { default = rgba(255,255,255,0.05), type = input.color },
    support_width  = input { default = 1, type = input.line_width}
}

nom = hlc3 - sma (hlc3, period)
denom = mad (hlc3, period) * 0.015

res = nom / denom

fill_area (overbought, oversold, "", bg_color)

plot (res, "CCI", color, width)

hline { value = overbought, color = overbought_color, width = support_width, style = style.dash_line }
hline { value = oversold, color = oversold_color, width = support_width, style = style.dash_line }

hline { value = 120, color = rgba(255,255,255,0.2), show_label = false }
hline { value = -120, color = rgba(255,255,255,0.2), show_label = false }
Formula
The formula for calculating CCI is:
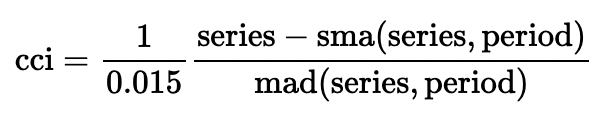
The indicator takes the difference between the asset price and the average value of it, dividing by the Mean Absolute Deviation of the price value. The 1/0.015 ratio ensures that approximately 70–80% of values fall within the ±100 range.