CMO
Source
Syntax Format
cmo(series, period)
Overview
CMO (Chande Momentum Oscillator) is an indicator in the Momentum group, whose main purpose is to provide information on the trend direction and its strength. Also, the CMO indicator can show whether the asset is overbought or oversold.
Parameters
| Parameter | Type | Purpose |
|---|---|---|
| series | series | Input series, taken into calculation |
| period | integer | Period, taken into calculation |
Returns: series.
Example
instrument { name = "Chande Momentum Oscillator" }

input_group {
    "CMO Line",
    period = input (9, "period", input.integer, 1),
    color  = input { default = "#57A1D0", type = input.color },
    width  = input { default = 1, type = input.line_width}
}

input_group {
    "Support Lines",
    overbought = input (50, "overbought", input.double, 0, 100, 1, false),
    oversold = input (-50, "oversold", input.double, -100, 0, 1, false),

    overbought_color  = input { default = rgba(37,225,84,0.50), type = input.color },
    oversold_color  = input { default = rgba(255,108,88,0.50), type = input.color },
    bg_color  = input { default = rgba(255,255,255,0.05), type = input.color },
    support_width  = input { default = 1, type = input.line_width}
}

fill_area (overbought, oversold, "", bg_color)

plot (cmo (close, period) * 100, "CMO", color, width)

hline { value = overbought, color = overbought_color, width = support_width, style = style.dash_line }
hline { value = oversold, color = oversold_color, width = support_width, style = style.dash_line }

hline { value = 100, color = "#000000", show_label = false }
hline { value = -100, color = "#000000", show_label = false }
Formula
The formula for calculating CMO is:
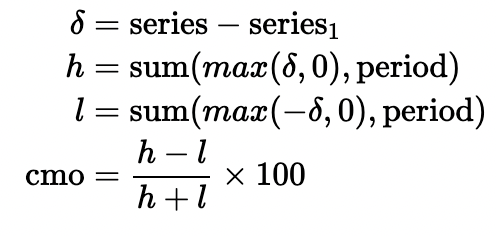
The indicator considers the sum of up-day price changes versus down-day price changes over the chosen period.