Your First Indicator
Let’s go from theory to practice. We can take a simple code example to understand how the calculation works and how it is represented in the traderoom.
Think of a script as an instruction for the computer — it runs your calculations and displays the result as a custom indicator (or a combination of them) applied to your asset in the traderoom in real time.
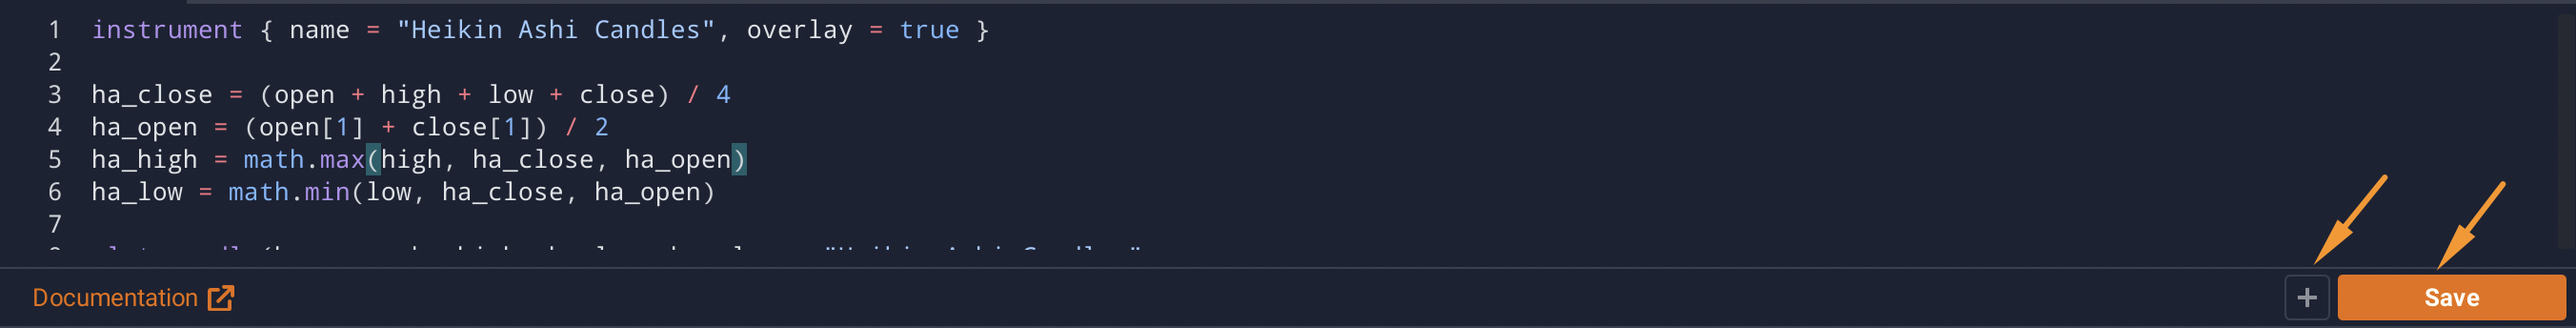
As an example, let's take the Heikin Ashi candles – a type of the candle chart pattern, which is calculated slightly differently than classic Japanese candles, and is quite popular among fellow traders. The first step – declare the instrument, in other words, your indicator's name and its representation in the traderoom.
Declaration Settings
Instrument
This function is really important as it declares the instrument, in other words – the indicator, which you are about to create. The syntax for this function looks like this:
instrument { name = "Heikin Ashi Candles", overlay = true }
In the Instrument function, you need to specify the main initial parameters of an indicator. You can check the instrument article for more details.
Calculation Settings
The calculation part of the Heikin Ashi chart is based on the specific price values, included in a candle.
ha_close = (open + high + low + close) / 4
ha_open = (open[1] + close[1]) / 2
ha_high = math.max(high, ha_close, ha_open)
ha_low = math.min(low, ha_close, ha_open)
Calculation #1:
ha_close = (open + high + low + close) / 4
Here, we count the closing value of the candle: take 4 values of a candle – opening price, closing price, the highest price within the candle, the lowest price within the candle, and divide the result by the number of values, which is 4.
Calculation #2
ha_open = (open[1] + close[1]) / 2
Here, we count the opening value of the candle: take the opening price of the previous candle, add the closing price of the previous candle, and divide the result by the number of values, which is 2.
Calculation #3
ha_high = math.max(high, ha_close, ha_open)
Here, we count the highest value of the candle (highest high), which is shown as an upper wick of a candle: take the highest value among the opening, closing values we just calculated, and the highest price value within the candle.
Calculation #4
ha_low = math.min(low, ha_close, ha_open)
Here, we count the lowest value of the candle (lowest low), which is shown as a lower wick of a candle: take the lowest value among the opening, closing values we just calculated, and the lowest price value within the candle.
So far, our script should look like this:
instrument { name = "Heikin Ashi Candles", overlay = true }

ha_close = (open + high + low + close) / 4
ha_open = (open[1] + close[1]) / 2
ha_high = math.max(high, ha_close, ha_open)
ha_low = math.min(low, ha_close, ha_open)
Now you need to add settings, allowing the indicator to be shown on the chart.
Display Settings
Plot Display
The plot settings allow you to represent your calculation as a chart in the traderoom. Depending on the plot details, it can look differently. The plot settings for our Heikin Ashi example can look like this:
plot_candle(ha_open, ha_high, ha_low, ha_close, "Heikin Ashi Candles",
    ha_open < ha_close and bullish_color or bearish_color)
Here, we used the plot_candle function, which displays the candle according to its following values:
- open – the opening price of the candle.
- high – the highest price of the candle.
- low – the lowest price of the candle.
- close – the closing price of the candle.
Then, we need to mention in the script whether the candle is a bullish or a bearish one. For that purpose, you need to add the following condition:
ha_open < ha_close and bullish_color or bearish_color
This condition means that if the opening price of a candle is less than the closing price, the script displays the bullish color. And the opposite – if the opening price of a candle is more than the closing price, the script displays the bearish color.
Let's look at the script, which you have created so far:
instrument { name = "Heikin Ashi Candles", overlay = true }

ha_close = (open + high + low + close) / 4
ha_open = (open[1] + close[1]) / 2
ha_high = math.max(high, ha_close, ha_open)
ha_low = math.min(low, ha_close, ha_open)

plot_candle(ha_open, ha_high, ha_low, ha_close, "Heikin Ashi Candles",
    ha_open < ha_close and bullish_color or bearish_color)
Now let's add some color.
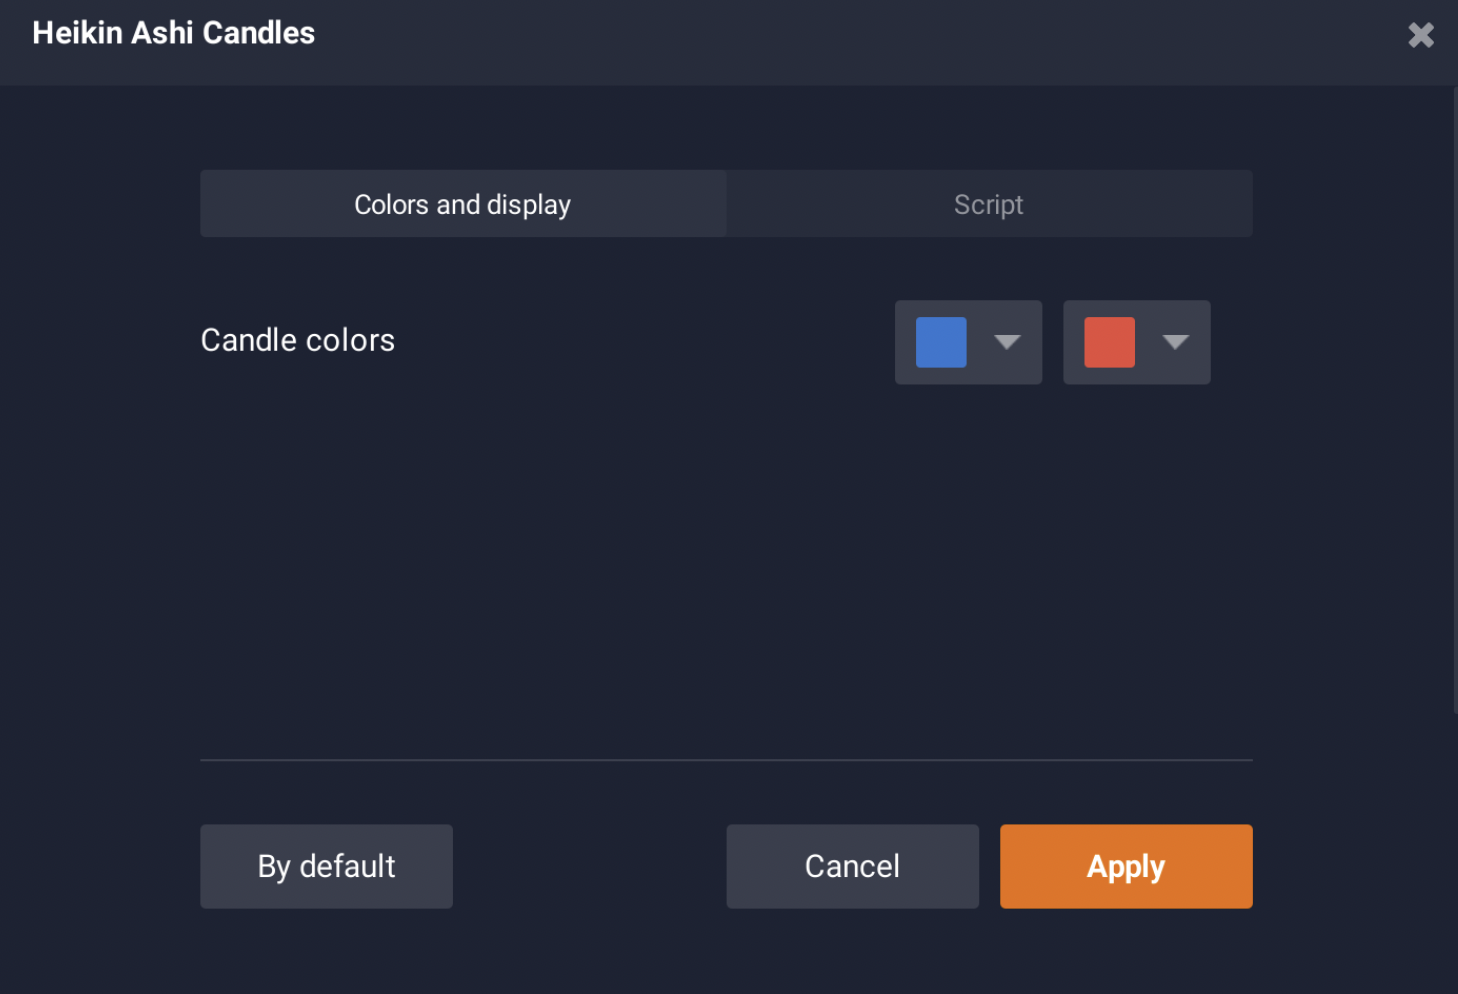
Color Customization
The last step for our example is to add color customization settings to the indicator. For that, you need to add the following code block to the script:
input_group {
    "Candle colors",
    bullish_color = input { default = "#2E77D1", name = "Bullish Candle", type = input.color },
    bearish_color = input { default = "#E74C3C", name = "Bearish Candle", type = input.color }
}
For this purpose, the input group was added, responsible for bullish and bearish candles. The colors in the script are the default for this type of candle chart.
The final script looks like this:
instrument { name = "Heikin Ashi Candles", overlay = true }

ha_close = (open + high + low + close) / 4
ha_open = (open[1] + close[1]) / 2
ha_high = math.max(high, ha_close, ha_open)
ha_low = math.min(low, ha_close, ha_open)

plot_candle(ha_open, ha_high, ha_low, ha_close, "Heikin Ashi Candles",
    ha_open < ha_close and bullish_color or bearish_color)

input_group {
    "Candle colors",
    bullish_color = input { default = "#2E77D1", name = "Bullish Candle", type = input.color   },
    bearish_color = input { default = "#E74C3C", name = "Bearish Candle", type = input.color }
}
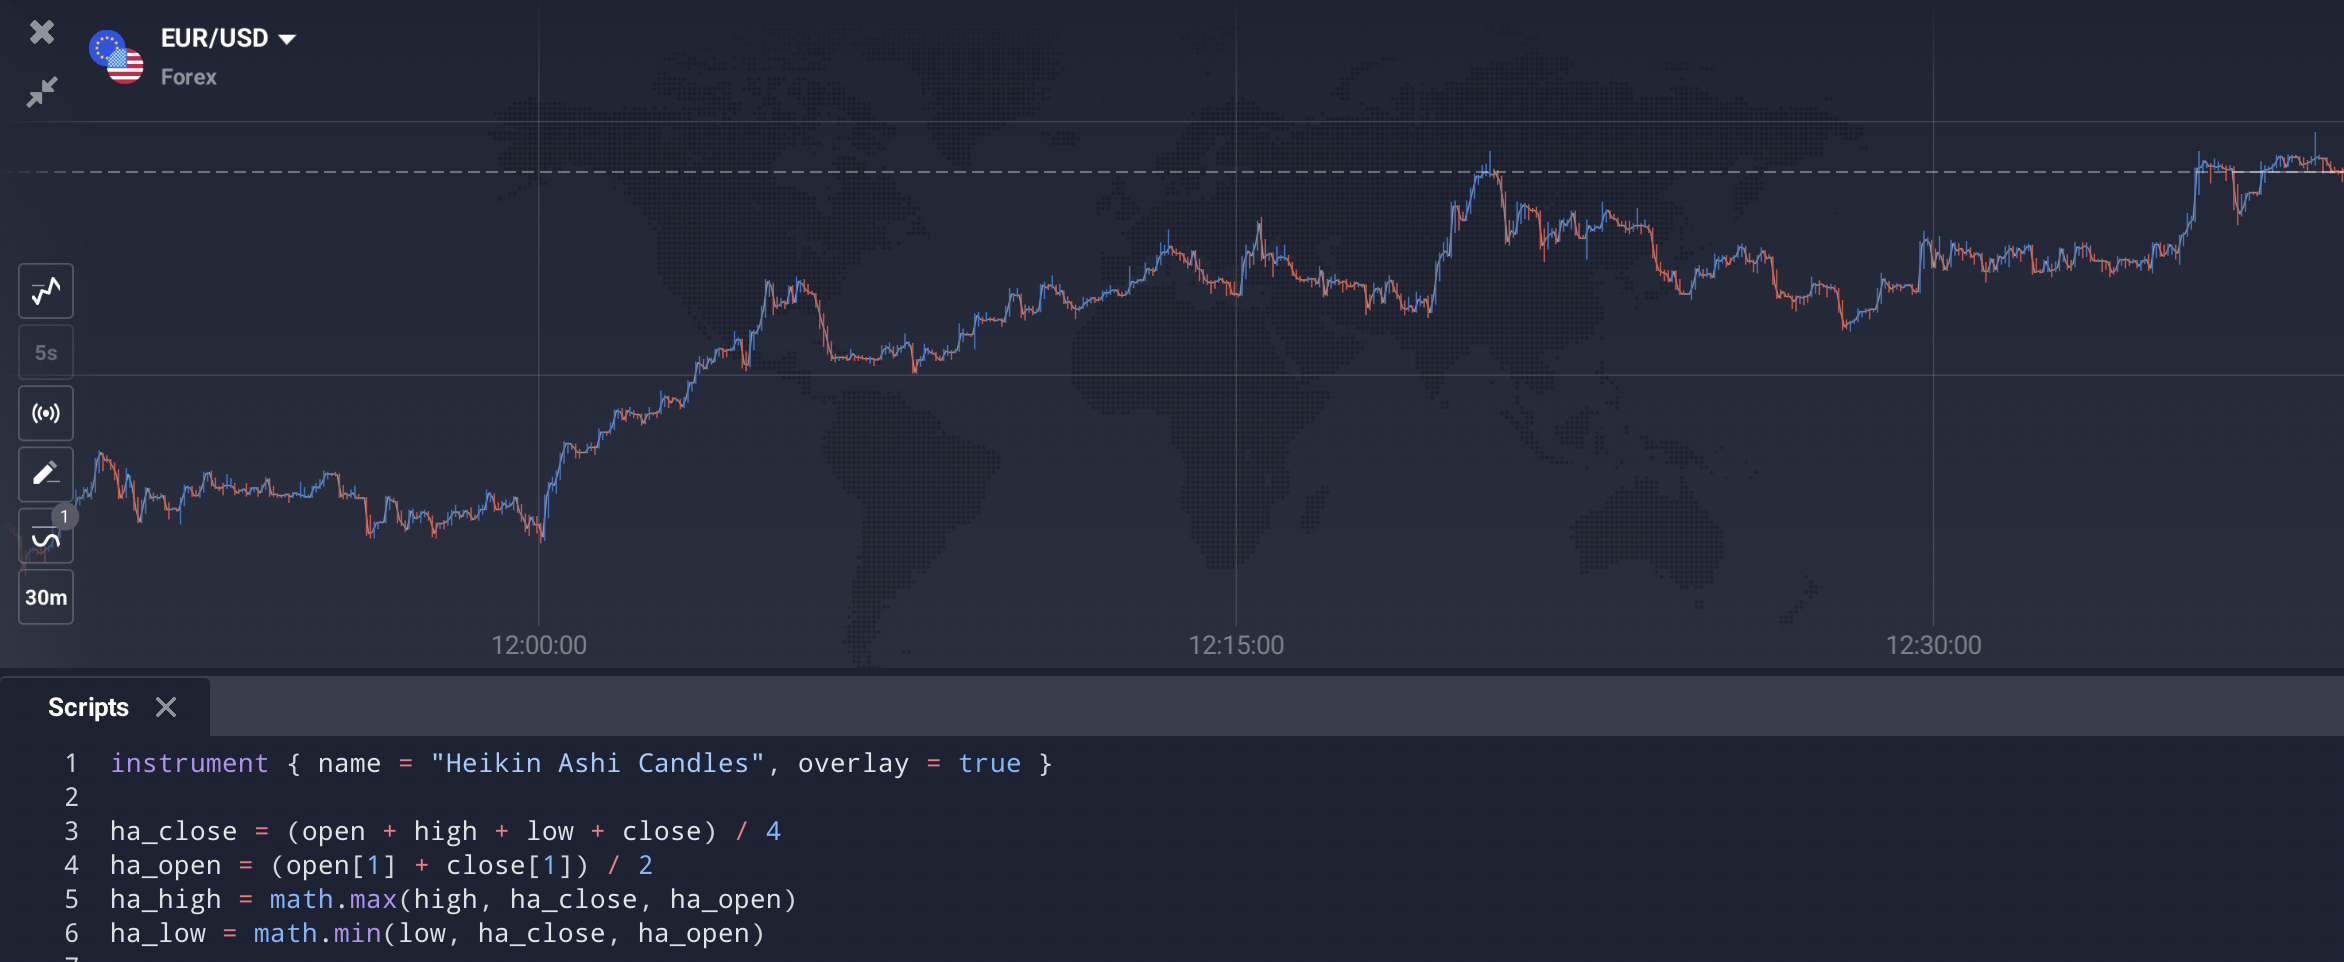
The most important and interesting part is to see how it looks in the traderoom. Once you have entered the script code in the editor, you need to click Save and then Add to the chart.
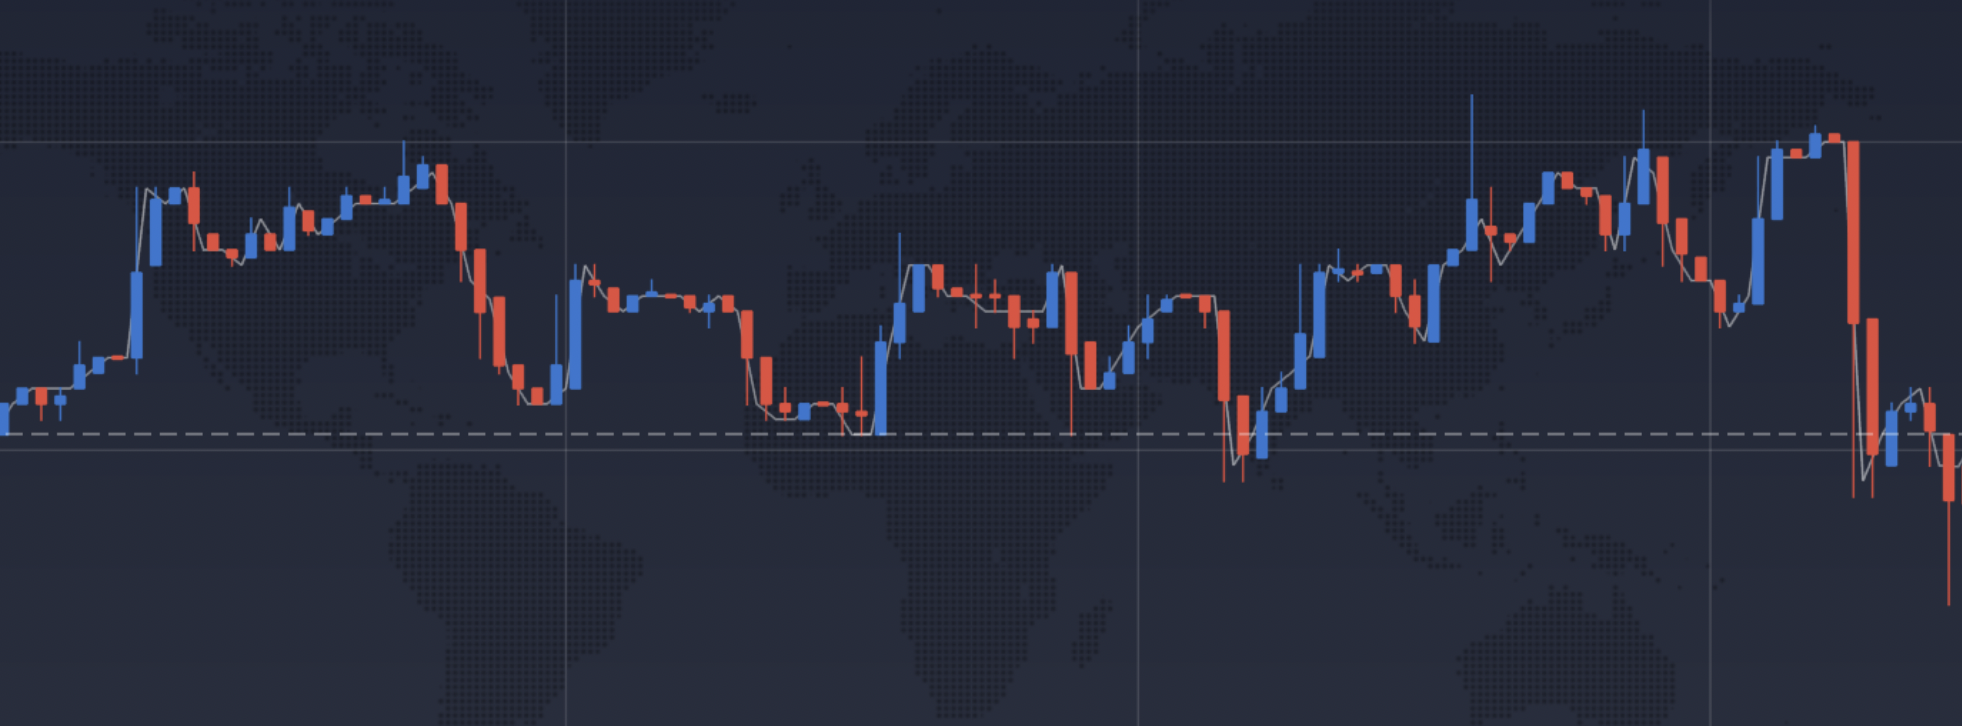
 The candles will look the following way on the chart:
 Once you zoom in on the chart, you will see a gray line, representing the default chart type, and the Heikin Ashi candles, displayed according to the script.
 Congratulations! You have just created and successfully applied your first custom script!
Now you can manage the indicator in the settings dialog.
More Basic Settings
Period
In the Period function, you indicate the time intervals, which will be taken into the calculation of the indicator. It can be minutes/days/months/years. Visually, they are usually presented on the asset chart as candles or bars. The syntax for this function looks like this:
period = input (14, "Period", input.integer, 1)
Several ground rules for the Period function:
- The number should be positive and more than 1.
- The number should be Integer.