SMA
Source
https://github.com/quadcode-tech/quadcodescript-library/blob/master/averages/ma_sma.lua
Syntax Format
sma(series, period)
Overview
SMA (Simple Moving Average) smoothes the price data by providing the averaged price value for the chosen timeframe. Because it is the most basic Moving Average, each price value is given the same weight. You can use SMA as part of more complex indicators as well as on its own to identify potential trend reversals.
Parameters
| Parameter | Type | Purpose |
|---|---|---|
| source | series | Input series, taken into calculation |
| period | numeric | Moving Average period |
Returns*: series.
*If there are less than period values in the series – the result is nan.
Example
instrument { name = "Simple Moving Average", short_name = "SMA", overlay = true, icon="indicators:MA" }

period = input (9, "period", input.integer, 1)
source = input (1, "source", input.string_selection, inputs.titles_overlay)

input_group {
    "SMA Line",
    color = input { default = "#DB4931", type = input.color },
    width = input { default = 1, type = input.line_width}
}

local sourceSeries = inputs [source]

plot (sma (sourceSeries, period), "SMA", color, width)
Formula
The formula for calculating SMA is:
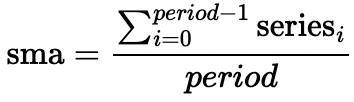
The calculation of the SMA is quite straightforward: the sum of price series over the chosen period divided by the chosen period (1, 14, 25, etc.).