RSI
Source
https://github.com/quadcode-tech/quadcodescript-library/blob/master/momentum/rsi.lua
Syntax Format
rsi(series, period)
Overview
RSI (Relative Strength Index) is a momentum oscillator, which provides data on the change of the given series over a specified period. As this indicator also contains overbought and oversold threshold lines, it can indicate the corresponding states of an asset.
Parameters
| Parameter | Type | Purpose |
|---|---|---|
| series | series | Input series, taken into calculation |
| period | integer | Input period, taken into calculation |
Returns: series.
Example
instrument { name = "RSI", icon="indicators:RSI" }

input_group {
    "RSI",
    period = input (14, "period", input.integer, 1),
    source = input (1, "source", input.string_selection, inputs.titles),
    fn     = input (averages.ssma, "average", input.string_selection, averages.titles),

    color  = input { default = "#B42EFF", type = input.color },
    width  = input { default = 1, type = input.line_width}
}

input_group {
    "Support Lines",
    overbought = input (70, "overbought", input.double, 1, 100, 1, false),
    oversold = input (30, "oversold", input.double, 1, 100, 1, false),

    overbought_color  = input { default = rgba(37,225,84,0.50), type = input.color },
    oversold_color  = input { default = rgba(255,108,88,0.50), type = input.color },
    bg_color  = input { default = rgba(255,255,255,0.05), type = input.color },
    support_width  = input { default = 1, type = input.line_width}
}

local sourceSeries = inputs [source]
local averageFunction = averages [fn]

delta = sourceSeries - sourceSeries [1]

up = averageFunction (max (delta, 0), period)
down = averageFunction (max (-delta, 0), period)

rs = up / down
res = 100 - 100 / (1 + rs)

fill_area (overbought, oversold, "", bg_color)

plot (res, "RSI", color, width)

hline { value = overbought, color = overbought_color, width = support_width, style = style.dash_line }
hline { value = oversold, color = oversold_color, width = support_width, style = style.dash_line }

hline { value = 90, color = rgba(255,255,255,0), show_label = false }
hline { value = 10, color = rgba(255,255,255,0), show_label = false }
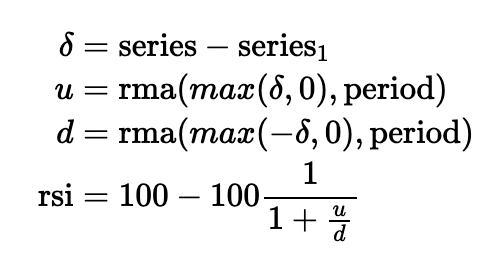
Formula
The formula for calculating RSI is: